USA Peanut Production
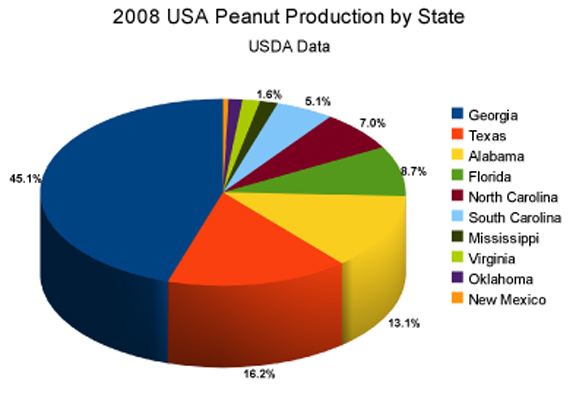
The top USA peanut producers for 2008 were Georgia with 45%, Texas 16%, Alabama 13%, Florida 9%, North Carolina 7%, South Carolina 5%, Mississippi 2%, Virginia 2%, Oklahoma 1% and New Mexico 0.5%.
E.A.R. To The Ground is a project designed to connect global and local scales of agriculture.

| Rank | Country | Production (tones) |
| 1 | Italy | 8,519,418 |
| 2 | France | 6,500,000 |
| 3 | China | 6,250,000 |
| 4 | United States | 6,105,000 |
| 5 | Spain | 6,013,000 |
| 6 | Argentina | 2,900,000 |
| 7 | Chile | 2,350,00 |
| 8 | South Africa | 1,600,000 |
| 9 | Australia | 1,530,439 |
| 10 | Brazil | 1,341,806 |
| 11 | Germany | 1,300,000 |
| 12 | Portugal | 1,050,000 |
| 13 | Greece | 950,000 |
| 14 | Romania | 821,306 |
| 15 | Moldova | 598,000 |
| 16 | Hungary | 543,400 |
| 17 | Ukraine | 415,000 |
| 18 | Austria | 329,825 |
| 19 | Russia | 328,810 |
| 20 | Bulgaria | 200,000 |

 As shown in the graph, the current table grape production amounts to over 60.000 MT, with a constant growth since the early 90s. According to Juan Martín Rosauer of C.A.F.I. (Argentinian chamber of fruit producers), custom duties for Argentinian grapes has weighted 8% on the final price in 2006, in comparison with a weight of 2,3% for the Chilean ones.
| Vermont Maple Syrup Grades Definitions for the different grades of Vermont Maple Syrup |


Hottest Peppers |
 |


Recent studies indicate that increased frequency of heat stress, droughts and floods negatively affect crop yields and livestock beyond the impacts of mean climate change, creating the possibility for surprises, with impacts that are larger, and occurring earlier, than predicted using changes in mean variables alone. This is especially the case for subsistence sectors at low latitudes. Climate variability and change also modify the risks of fires, pest and pathogen outbreak, negatively affecting food, fiber and forestry.
 Rising atmospheric concentrations of CO2: Increasing atmospheric CO2 levels, driven by emissions from human activities, can act as a fertilizer and enhance the growth of some crops such as wheat, rice and soybeans. CO2 can be one of a number of limiting factors that, when increased, can enhance crop growth. Other limiting factors include water and nutrient availability. While it is expected that CO2 fertilization will have a positive impact on some crops, other aspects of climate change (e.g., temperature and precipitation changes) may temper any beneficial CO2 fertilization effect (IPCC, 2007).
Moderate climate change will likely increase yields of North American rain fed agriculture, but with smaller increases and more spatial variability than in earlier estimates. Most studies project likely climate-related yield increases of 5-20 percent over the first decades of the century, with the overall positive effects of climate persisting through much or all of the 21st century.
| Grains | |
| Fruits | Apples, pears, peaches, plums, oranges, olives, figs, cranberries, avocados, pineapples |
| Vegetables | |
| Cattle food | |
| Other crops | Cotton, flowers |
| |
| The picture to the right is an example of irrigation on a farm. Irrigation is when a farmer has to spray water on his crops because the rain isn't enough. These sprayers travel over the fields on wheels, spraying as they move. |  |
| Get the soil ready to plant [make a place for the seeds or plants to be planted.] | |
| Plant the crop. | |
| Cultivate the crop. [Pull out and bury the weeds between plants.] | |
| Pick the crop and separate it into its usable parts. | |
| Sell the crop, store it, or make it into food. Some crops become feed for animals and are stored in silos. |
| Major agricultural crops produced in the United States in 2000 (excluding root crops, citrus, vegetable, etc). | ||
|---|---|---|
| Crop | Harvested Area (million acres) | Cash Receipts from Sales ($ billion) |
| Corn (grain) | 72.7 | 15.1 |
| Soybeans | 72.7 | 12.5 |
| Hay | 59.9 | 3.4 |
| Wheat | 53.0 | 5.5 |
| Cotton | 13.1 | 4.6 |
| Sorghum (grain) | 7.7 | 0.82 |
| Rice | 3.0 | 1.2 |
| Commodity groups cash receipts - 2004 | |||
|---|---|---|---|
| Product Group | Value ($1,000) | % State total | State rank |
| All commodities | 63,825 | 100.0% | 49 |
| Livestock & livestock products | 9,812 | 15.4% | 50 |
| Crops | 54,013 | 84.6% | 49 |
| Source: USDA:Economic Research Service | |||
| Rhode Island's top five commodities by cash receipts - 2004 | |||
|---|---|---|---|
| Livestock products | % State total | Crop products | % State total |
| Dairy products | 5.4% | Greenhouse/nursery | 64.5% |
| Cattle and calves | 1.5% | Corn, sweet | 5.9% |
| Aquaculture | 0.9% | Potatoes | 1.8% |
| Hogs | 0.5% | Apples | 1.4% |
| Farm chickens | < 0.1% | Hay | 1.2% |
| Source: USDA:Economic Research Service | |||
| Leading commodities for cash receipts - 2004 | |||
|---|---|---|---|
| Product | Value ($1,000) | % State Value | |
| 1. Greenhouse/nursery | 41,155 | 64.5% | |
| 2. Corn, sweet | 3,762 | 5.9% | |
| 3. Dairy products | 3,434 | 5.3% | |
| 4. Potatoes | 1,124 | 1.8% | |
| 5. Cattle and calves | 938 | 1.5% | |
| 6. Apples | 893 | 1.4% | |
| 7. Hay | 759 | 1.2% | |
| 8. Aquaculture | 564 | 0.9% | |
| 9. Hogs | 344 | 0.5% | |
| 10. Farm chickens | 1 | Less than 0.1% | |
| Chicken eggs * | |||
| Honey * | |||
| * Commodities at the bottom of the above ranked list of commodities and having no accompanying data would have appeared within the ranked list of leading commodities, but were excluded to avoid disclosure of confidential information about individual producers. | |||
| Source: USDA:Economic Research Service | |||
| Rhode Island farms and farmland - 2004 | |||
|---|---|---|---|
| Number of farms | Total farm acres | Percent of state | Average farm size (acres) |
| 850 | 60,350 | 9% | 71 |
| Source: USDA:National Agriculture Statistics Service | |||